
 by Marty Deitch (also published in z/Journal) The mainframe has most certainly defied the predictions of industry pundits; in fact, in the past 10 years, most mainframe shops have grown their MIPS capacity by 15 to 25 percent per year. This increase reflects both more work and new kinds of work. The “new workloads” may be z/OS transactions arriving from outboard distributed servers or UNIX applications now running under Linux on System z on Integrated Facility for Linux (IFL) processors. The result is a significantly larger mainframe presence than the pundits anticipated. Systems management strengths, disciplines and tooling that have grown up with the mainframe, have contributed to its resilience. Systems management encompasses configuration management, change management, problem management, performance management, and capacity management. A successful IT organization must formalize these practices through documented processes covering who does what, when, and how. Clearly defined processes provide a consistent methodology for how this work is performed, even when personnel change, and ensures the organization’s high-level goals reflect the way systems are managed. Systems management methods vary widely. Capacity management (i.e., capacity planning) stands out as the least formalized, most problematic practice, and unfortunately, lags the other disciplines; this article describes capacity planning best practices. The Capacity Planner’s Role Despite capacity planning’s importance, most shops don’t have people dedicated to it. Often, it’s considered a part-time function, assigned to the same people doing performance management. Capacity planning is less well-defined than performance management, and many IT shops don’t clearly define what they want capacity planners to do. However, effective capacity planning includes knowing how to determine when the system is out of capacity, what reports to produce, and how often. The capacity planner must tell upper management when the company’s IT systems will no longer be able to provide acceptable service to end users. Since this is a planning function, it’s assumed this information will be made available before the event occurs. This job includes many sub-functions that support this kind of analysis, including workload tracking and trending, setting and monitoring Service Level Agreements (SLAs), and evaluating different upgrade scenarios. Defining Out of Capacity Capacity planning requires a clearly defined and agreed upon definition of what it means to be out of capacity, though this is often overlooked. Without a clear definition, how can the capacity planner develop a plan acceptable to management? The definition must be agreed to by all parties and must be the trigger that requires action to be taken. Consider some of the out of capacity definitions we’ve heard from IT managers:
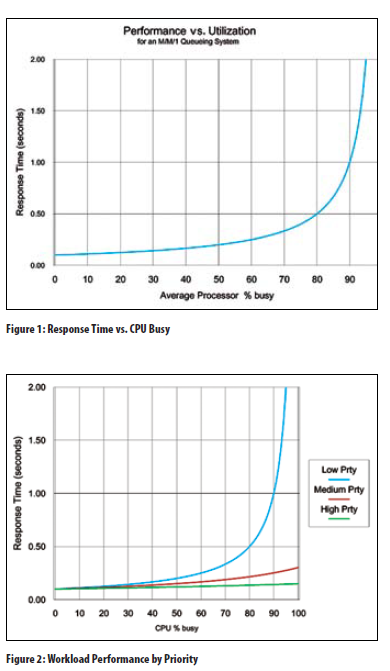
These definitions share a lack of formality and a clear linkage between high-level business goals and how IT resources should be managed. Today, many shops will say they have SLAs in place, but these are often negotiated between the operations staff and users. If SLAs are missed, a meeting often occurs to address the problem. The result might be a plan to look into tuning the system or application, but missing the SLA is a long way off from requiring a processor upgrade. A proper definition for out of capacity must be one that absolutely requires problem resolution, even if it means adding capacity. While processor capacity is the focus of most capacity planners, all IT components —including disk, tape, network, or any component that affects your ability to meet your definition of out of capacity—must be included in the planning process. Performance Management vs. Capacity Management While performance management and capacity management look similar on the surface, they’re different practices and must be treated as such. Performance management involves responding to performance problems that can pop up anytime without warning. Capacity management involves a much larger component of planning. The goal is to anticipate when performance will become unacceptable and to have a plan to fix the problem before it occurs. Though the differences between the two practices are significant, most shops assign both performance and capacity planning to the same people. That makes it easy to confuse your role when constructing a capacity plan. Here’s an example of where you can mix these roles. A capacity planner reports that, based on his analysis, the system will be out of capacity in six months. He also reports that, based on previous tuning results, he believes he can tune around the problem. This is the case of the capacity planner wearing his performance management hat while performing capacity planning. If the tuning doesn’t yield expected results, this shop may find itself out of capacity with no plan in place. Capacity planners must always begin by assuming the current system is the starting point. If tuning activities change the system, then the changes must be factored into the plan. A capacity plan is a living plan; it must be updated regularly, ideally at least once a month. Since the person doing the tuning may also be the person asked to provide the capacity plan, he must understand the differences in the two functions. Understand Your Pain Points Most shops will have more than one definition for out of capacity. These will depend on where and when the pain occurs. For example, you might have a pain point that occurs during prime shift, between 9 a.m. and 4 p.m. The pain point might be online response times for your production CICS applications. For this shop, a definition of out of capacity might be, “We’re out of capacity when the 95th percentile response times for our production CICS systems exceeds two seconds between 9 a.m. and 4 p.m.” This same shop might have a batch window pain point that occurs each night. This might require another definition such as, “We’re out of capacity when the nightly batch job stream doesn’t complete by 7 a.m.” Some financial institutions have a 10-minute window each morning at market open time. They must process all the queued stock transactions during this brief window or pay penalties. Understanding your pain points greatly simplifies the capacity planning process. It directs you to where you need to focus your data collection and tracking systems. It also lets you ignore activities irrelevant to predicting when you’ll be out of capacity. Develop Tracking and Reporting Systems Once you’ve defined your key pain points and out-of-capacity definitions, you can begin to develop tracking and reporting systems. These should focus on building the databases used for historic trending. Many shops use tools that capture lots of metrics and store them in databases that statistical analysis programs can manipulate. Many shops lack a clear view of how these metrics are related, including which ones will indicate when performance will cross the knee of the curve. Again, understanding your pain points will help you focus on the key metrics during the times they’re important. For example, if your pain point is CICS performance during prime shift, you need to track metrics for those periods. Further, tracking systems must include both workload volume metrics (i.e., CICS transaction rates) and performance metrics (i.e., 95th percentile CICS response times). If your pain point is nightly batch Window performance, you should be tracking metrics such as average Window completion times each night, number of disk I/Os completed during these times, average disk response times, and total CPU utilization. These metrics will support trending and predict changes in workload volumes. They also help you understand the relationships between workload volume and performance. For example, you might see a correlation developing between CICS performance degrading whenever CICS transaction rates exceed a specific value. This can lead to further exploration and hopefully result in a better understanding of how resource contention affects CICS performance. But this kind of analysis requires you to have historical data that’s relevant. Once you begin to build these tracking systems and do some performance correlation, you’ll see that some metrics are irrelevant while others are missing. It’s an iterative process. The goal is to construct a tracking and reporting system that shows where you’ve been and where you’re going. Moreover, this system lets you focus on your specific pain points. Predict Performance Changes The goal for capacity planning is to predict when you’ll run out of capacity before it happens. If you tell upper management you’re out of capacity today, or even next week, you aren’t planning; you’re reacting. Advances in mainframe technology, including the ability to provide capacity on demand in minutes, makes the need for capacity planning less important. But even short-term increases in capacity can increase costs, and permanent upgrades can have a dramatic impact on the IT budget. While hardware costs continue to decrease, software costs associated with available capacity are still the largest component (along with people costs) of the Total Cost of Ownership (TCO). While recent advances in adding capacity make it easier to react to peak loads or unexpected changes, they don’t reduce the sting of unexpected changes to the IT budget. Perhaps the biggest reason capacity planning is difficult is that the key metric for predicting out of capacity is performance, and predicting changes to workload performance is hard to do. While workload volume changes can be tracked, trended, and forecast with reasonable accuracy, performance is subject to queuing effects. Figure 1 shows the relationship between performance and utilization; it’s based on a simple queuing model involving a single queue and single server. This curve shows that performance has a non-linear relationship with server utilization. The message is that performance may remain on the flat part of the curve as utilization grows, then quickly degrade as you pass the knee of the curve. Things can go bad in a hurry, with little warning, and trying to predict when that will happen is difficult. Compounding the problem is the fact mainframes run more than one kind of workload, and they run at different priorities. Figure 2 presents a similar curve as Figure 1, but shows the relationships between different workload types running at different priorities. Even at high utilization, some workloads may still be on the flat part of the curve while others are clearly broken. The difficulty for the capacity planner is to understand these relationships and predict the shapes of these curves. One approach is to track utilization and performance metrics over time and look for patterns that indicate when performance crosses the knee of the curve. This approach has led many shops to develop rules of thumb that define out of capacity in terms of utilization; for example, “We’re out of capacity when prime shift utilization exceeds 95 percent.” There are numerous problems with these kinds of definitions. Most were developed years ago and passed down without modification, even as personnel changed. They tend to be outdated and too conservative, and call for upgrades much sooner than they’re really needed. For most companies, workloads and systems have changed dramatically since these rules were developed. New mainframe workloads tend to be CPU-intensive compared to older legacy applications; many are delivered as packaged solutions. Examples include Enterprise Resource Planning (ERP) applications such as those from SAP and PeopleSoft. One characteristic of these workloads is that they often contain a dynamic element that lets the user construct ad-hoc queries and reports. These ad hoc requests often initiate a complete scan of one or more databases. These requests can easily drive CPU utilization to 100 percent and keep it there for minutes or hours. Since these transactions are allowed to run for long periods, there’s no need to upgrade the processor simply because they drive utilization to 100 percent. A capacity planning rule of thumb that simply looks at total CPU utilization won’t work well with systems running these new workloads. Performance Modeling Tools The answer to the problems inherent with predicting changes to workload performance is a modeling tool. These tools let you define your configurations and workloads as inputs. Modeling outputs should include resource utilization and workload performance. A good modeling tool must be able to account for non-linear queuing effects. To be effective, these tools must be able to model metrics that correspond to your out of capacity definitions. For example, if your definition is based on CICS response times, your modeling tool must be able to predict changes to CICS response times. Similarly, for a definition based on batch job stream completion times, the tool must be able to predict those times. There are several mainframe modeling tools available and lots of differences between them in capabilities and ease-of-use; these differences are beyond the scope of this discussion. Despite the availability of modeling tools, most shops don’t use them for capacity planning. Some say they purchased a tool years ago, but the people who were trained to use it no longer work at the company. Or, they say they looked at purchasing a tool, but couldn’t justify the high cost. The overwhelming majority of shops today don’t use modeling tools for capacity planning. You should perform a cost/benefits analysis and examine your individual circumstances to determine whether you can justify a modeling tool for capacity planning. The key questions to ask include:
Many shops can easily justify the purchase of a modeling tool if they do a proper cost/benefits analysis, but it isn’t necessary for every shop to buy these tools. If your current methodology works, keep using it. Processor Sizing At some point in the capacity planning process, you’ll be required to project your requirements against different configuration alternatives. Usually, this will be an evaluation of different processor models and will certainly require an evaluation of the processor’s price and capacity. While processor capacity analysis seems fairly simple and straightforward, this is one of the most problematic parts of the capacity planning process. The following describes how to improve this critical function and avoid some common pitfalls. For many shops, processor sizing relies on tables of MIPS ratings—some provided by industry consultants and some by the vendor—where a rating is assigned to every processor model, spanning old and new generations. All these tables have a common flaw—they contain a single MIPS rating for each processor. Also, no one, including IBM, measures MIPS today. IBM measures relative capacity between its different processor models. Often referred to as the Internal Throughput Rate Ratio (ITRR), this is a measure of the relative capacity between different processors. If the ITRR between two models is 2:1, it means the first model has twice the capacity as the second (i.e., if both machines were running at 100 percent busy, the first machine would be processing twice the workload). IBM measures these ratios between all its processor models and publishes the results in the IBM Large System Performance Ratios (LSPR) tables. If you were to look at these tables today (available at no cost through an IBM Website), you’d see several columns of numbers, depending on different workload types. That’s because different workloads perform differently on different processors. But relative capacity will also change based on the specific configuration you install and the specific Logical Partition (LPAR) configuration you run. IBM LSPR tables show the impact of different workload types, but don’t show the impact of configuration or LPAR differences. The only tool that shows the true impact of all these differences is the IBM z Processor Capacity Reference tool. The zPCR tool was an IBM proprietary tool until 2005 when it was made available, free of charge, to IBM customers. zPCR uses the IBM LSPR tables as a reference point but factors in the impact of workload type, hardware configuration, and LPAR definitions to calculate the true ITRR between different processor models. A highly accurate way to compare the relative capacity between different processor models in a real configuration, zPCR should be part of your capacity planning process. Beyond the Mainframe While this discussion is directed to the mainframe, the principles discussed here can be successfully applied to other platforms. Infrastructure simplification and server consolidation mean the days of adding another box when performance degrades are quickly disappearing. Mainframe capacity planning has always been years ahead of its distributed systems counterparts, but the gap is closing. Best practices require a common set of processes be implemented across all platforms. One of the biggest impediments to this goal is a lack of tooling that can span multiple platforms. Recent advances, such as the IBM zEnterprise BladeCenter Extension (zBX) system and Unified Resource Manager (zManager), demonstrate that vendors recognize the need to provide a single management perspective across all platforms. This is especially true with applications that span multiple platforms. While we’re a long way from this objective, this trend bodes well for systems management and capacity planning. Summary Mainframe capacity planning is the least formalized and rigorous practice under the systems management umbrella. Major changes to the kinds of work running on the mainframe today have invalidated many of the capacity planning rules of thumb developed years ago and still in use today. Workload performance, not utilization, is the key metric that determines when the phone rings, and that’s hard to predict. Effective capacity planning requires:
Capacity planning is an essential activity for all IT shops; the costs associated with doing a poor job can be enormous.
0 Comments
Leave a Reply. |
Marty DeitchZ Systems Performance and Capacity planning Expert at ArchivesCategories |
 RSS Feed